Deviations from the published algorithm¶
Everything here is deliberate, unit-tested, and recorded in the module docstrings next to the code. Check this page and the erratum before changing any of it.
The baseline is Miller et al. (2017), doi:10.1002/2017JD027365, as amended by the erratum published 26 February 2020.
1. Equations amended by the erratum¶
Equations 7, 21–22 and 24–25 are implemented in their erratum form. If you are reading the 2017 PDF, these five will not match the code; the difference comes from the erratum rather than from this implementation.
2. Corrections to equations the erratum does not cover¶
Three printed equations remain inconsistent with the paper’s own prose and figures after the erratum. Each is implemented per the prose, with the reasoning below.
Eq. 4 (CM2) — magnitude reversed¶
CM2 = 1 - N(BT10.4 - BT6.2; 0, 25) # deep convection → 1, clear → 0
As printed, clear sky — where the 10.4/6.2 µm split runs 25–55 K — yields CM2 ≈ 1, which saturates the cloud mask everywhere and degenerates the whole algorithm. The prose describes CM2 as behaving “in a similar fashion” to the already-reversed Eq. 1, and Figure 3c shows the reversed sense.
Eq. 11 (CM_day) — CM3 in place of CM4¶
CM_day = (CM1 + CM2 + CM3) * (1 - max(R1, R2_day))
The printed equation references CM4, but CM4 is the 3.9 µm test, which the paper itself defines as night-only. CM3 is the intended term.
Eq. 15 (DT3) — magnitude reversed¶
DT3 = clip(((T_MERRA - S) - BT10.4) / depth, 0, 1)
with the surface shift S = −10 K (land) / +5 K (ocean) applied as printed,
and depth = 50 K. The prose is explicit that “observations that are
relatively cold compared to MERRA produce high value for DT3”, which the
printed equation does not do.
Eq. 19 (CF normalization) — one interval per branch¶
CF_day = N(CF*_day; cf_norm_day)                      # 0.25–2.50 as printed
CF_ngt = N(CF*_ngt; cf_norm_ngt)                      # 0.125–1.25
CF_trm = N(CF*_trm; interpolated on B_ngt_trm)
As printed, Eq. 19 normalizes all three confidence factors with the single
interval (0.25, 2.50), but Eqs. 16–18 do not put them on one scale. Each DT
term saturates at 1, so the daytime sum DT1 + DT2 + DT3 reaches 3.0 while
the night sum max(DT1, DT2) + ½·DT3 reaches only 1.5 — night has no
independent second test, because without solar heating the 8.6 µm emissivity
contrast stops being independent of the split window. One shared interval
therefore caps CF_ngt at (1.5 − 0.25)/(2.50 − 0.25) = 0.556, against
1.0 for CF_day.
The effect is not a threshold artefact, it is the whole night side of the
product: on a Himawari AHI event (2021-03-15/16 north China) the same dust
that reads CF_day ≈ 0.50 by day reads CF_ngt ≈ 0.07 after dark. The two
branches agree on where the dust is (r = 0.58) and disagree on how much.
Eq. 22 blends across the terminator on cos θ, so there is no step to notice —
the dust simply appears to dissipate overnight.
The fix is one interval per branch, scaled by the ratio of the raw ceilings
(constants.NIGHT_CF_SCALE = 0.5). The floor scales with the ceiling for the
same reason: DT3’s clear-sky bias enters Eq. 18 at half the weight it has in
Eq. 16. CF_trm, whose ceiling (2.5) sits between the two, normalizes with
the interval interpolated on Eq. 20’s B_ngt_trm — the day interval where
Eq. 22 hands it to CF_day, the night interval where it hands it to
CF_ngt, so no new discontinuity is introduced.
CF_trm is the one branch whose interval is not scaled to its own ceiling,
and that is measurable. On the day side of 90° it rides the day interval,
built for a sum that reaches 3.0, while Eq. 17 reaches only 2.5, so the same
dust reads low by ½·f/(max − min) for a signal at fraction f of ceiling;
just past 90° the interval starts moving toward the night one and it reads
high instead. Against 42 dust days of station data (hourly, all hours,
Himawari AHI over East Asia) the mean CF_comb on dust stations dips to
0.056–0.064 over 80–95°, against 0.110 at 70–75° and 0.09–0.12 after 105°.
Giving CF_trm an interval of its own — the day interval times 2.5/3.0 —
recovers a quarter to two fifths of that over 80–90° and next to nothing over
90–95°, where the dip is the dust tests themselves weakening at the day/night
transition rather than any normalization.
ConfidenceConstants.cf_norm_trm is that hook. It is None by default, so
the shipped behaviour is the interpolation described above; set it to an
interval and CF_trm normalizes on that instead. The default is left alone
because the residual is bounded, because the fix is worth a fraction of a
notch rather than the notch, and because the evaluation behind those numbers
is not part of this package.
ConfidenceConstants(cf_norm=...) still accepts one interval and applies it
to both branches, which reproduces the printed behaviour exactly. It is an
InitVar, so it reads back as None rather than as an interval: code that
did constants.cf_norm.min raises instead of quietly normalizing with the
wrong bounds. Read cf_norm_day / cf_norm_ngt instead.
3. Ancillary data substitution¶
Surface emissivity: CAMEL in place of UWBF. The paper specifies the
monthly UW Baseline Fit (UWBF, CIMSS) 0.05° climatology, which requires a
separate CIMSS registration. The default here is its successor CAMEL
(CAM5K30EM, NASA LP DAAC), reachable with the same Earthdata credentials as
MERRA-2. Both carry an emissivity cube on labelled hinge-point wavelengths and
are interpolated linearly in wavelength, as the paper implies;
io.emissivity.load_band_emissivity accepts either file.
4. Optional ABI retune (not the default)¶
constants.ABI_TUNED raises the Eq. 19 lower bound from 0.25 to 0.40. It is
opt-in; DEFAULTS remains the paper’s values.
Why it exists: with this ancillary stack (ABI + MERRA-2 + CAMEL), DT3 carries a 0.2–0.5 clear-sky floor over land, because MERRA-2 skin temperature runs warmer than BT10.4 and the −10 K land shift adds to it. That floor leaks through low-cloud-mask pixels as a faint yellow tint over vegetated and low-cloud areas.
The images below are APNG: they animate in any modern browser and show their first frame everywhere else. The blink presentation is used because the change is a small shift in a low-amplitude field, which side-by-side panels hide.

cf_comb clipped to 0–0.15, the band containing the clear-sky floor. The
published floor leaks a speckle of confidence across the whole scene and a haze
over the vegetated southeast; the retune removes most of it. The dust plume is
untouched.
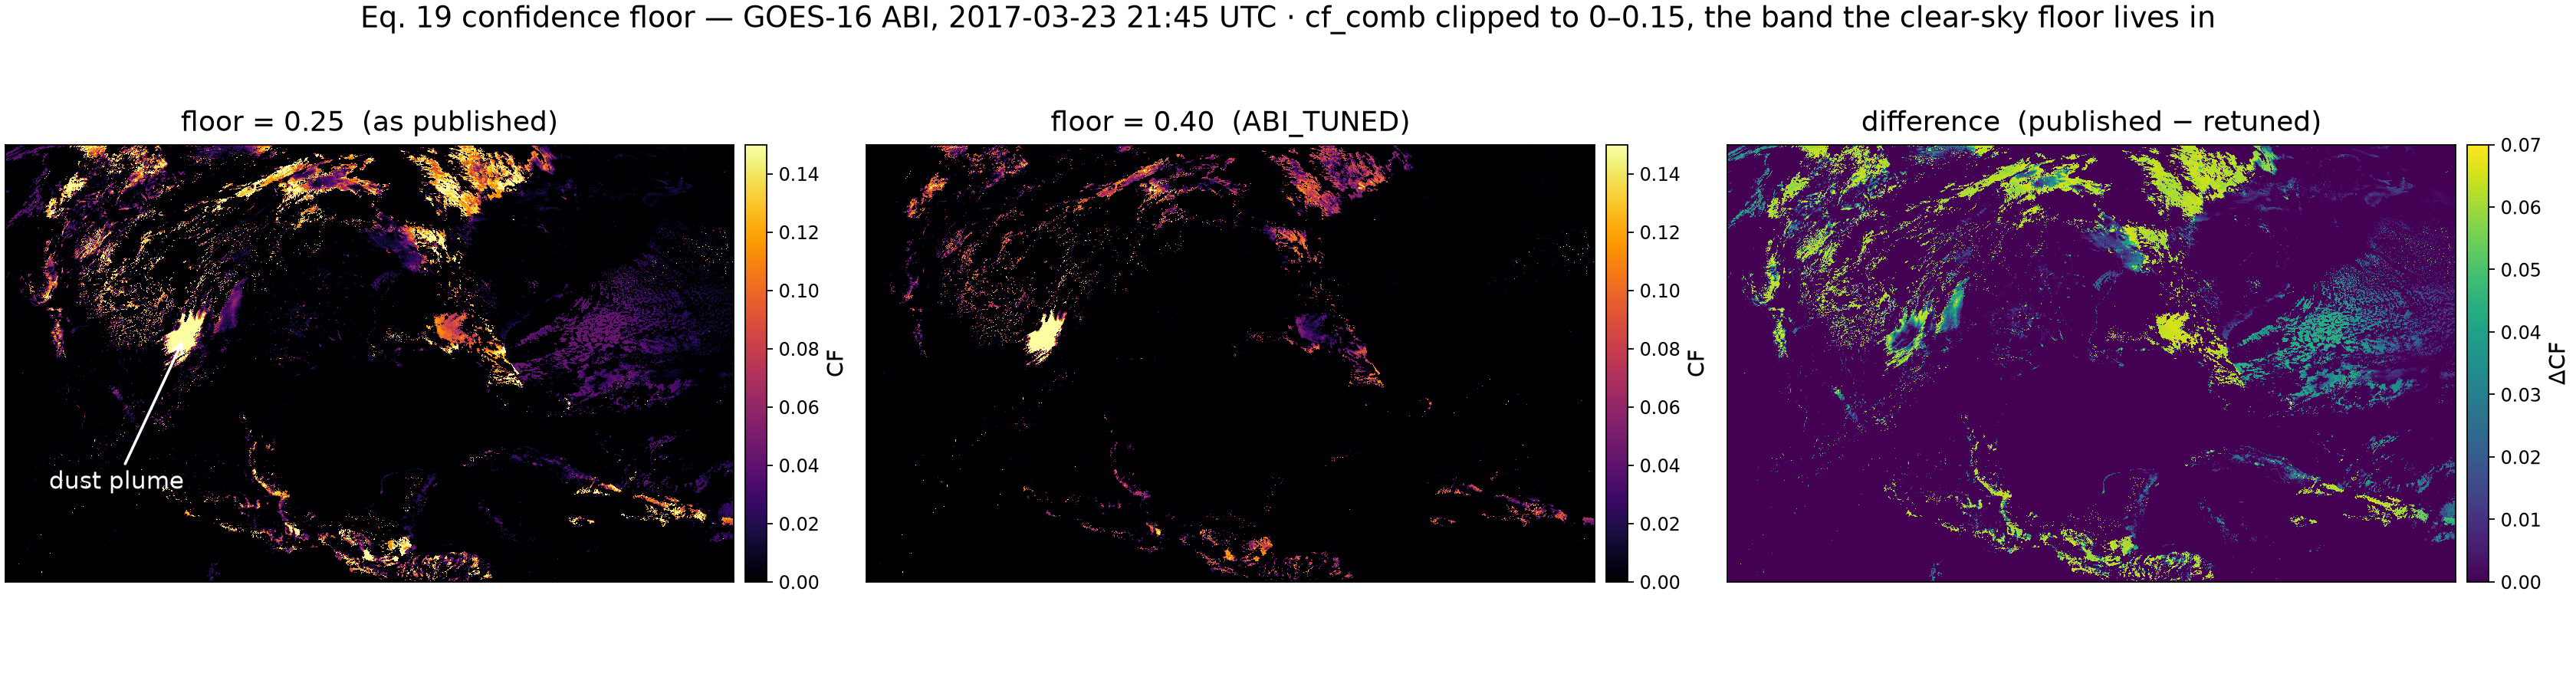
The same two states with their difference. ΔCF never exceeds 0.067, and is spread over a large area.

The same change in the finished imagery, cropped from the plume east to the Gulf coast and magnified 2×. Here the two states differ by at most 14/255 per pixel: the tint being removed sits at CF 0.05–0.10, which Eqs. 27–29 map to a handful of RGB levels. Running both settings therefore produces output images that look nearly identical, while the statistic below changes substantially.
Reproduce either state with
python scripts/run_case.py 2017-03-23-swus --tuning paper|abi.
Sweeping the floor across the three reference cases:
metric |
0.25 (published) |
0.30 |
0.35 |
0.40 ( |
0.45 |
|---|---|---|---|---|---|
2017-03-23 plume mean CF |
0.476 |
0.468 |
0.460 |
0.452 |
0.445 |
2017-03-23 SE-US vegetation, fraction CF > 0.05 |
0.368 |
0.340 |
0.172 |
0.028 |
0.006 |
2020-12-23 plume core mean |
0.202 |
0.184 |
0.166 |
0.150 |
0.135 |
2020-12-23 plume core p90 |
0.439 |
0.426 |
0.413 |
0.399 |
0.384 |
0.40 is the knee: 92% of the tinted area is gone for a 5% cost on the strong 2017 plume, and the moderate 2020-12-23 core still renders as saturated yellow (p90 ≈ 0.40 after Eqs. 27–29). 0.45 starts erasing the moderate case.
The paper anticipates “minor retuning” per sensor. Himawari AHI needs no
retune: the published bounds were tuned on AHI and transfer as-is. ABI_TUNED
is selectable on AHI but has not been validated there.
What is not a deviation¶
The composite background (
composite.py) is the paper’s own §3.2 alternative: a ~14-day rolling, cloud-cleared, same-time-of-day composite. It is offered alongside the semi-analytic background because it carries the split-window water-vapour depression that emissivity × Planck lacks, which otherwise zeroes DT1/DT2 on transparent winter plumes.Himawari AHI support is within the paper’s scope; the band mapping differs from ABI.
constants.pyvalues. Every calibration bound, offset and weight is transcribed from the paper and unit-tested against an independent transcription.ZHOUYE (
pipeline.run_zhouye,constants.ZHOUYE) is a separate scheme built on DEBRA’s chain, not a retune of it: its three hooks are off in every DEBRA preset, and by day its output is the ABI-retuned DEBRA exactly.